> For the complete documentation index, see [llms.txt](https://docs.lan.kokomocloud.com/llms.txt). Markdown versions of documentation pages are available by appending `.md` to page URLs; this page is available as [Markdown](https://docs.lan.kokomocloud.com/managing-devices/managing-gateway/diag-tools.md).
# 診断ツール
診断テストを実行して、ネットワーク管理者のトラブルシューティングに役立てることができます。
{% hint style="warning" %}
ゲートウェイ装置内の温度確認方法はありません。
{% endhint %}
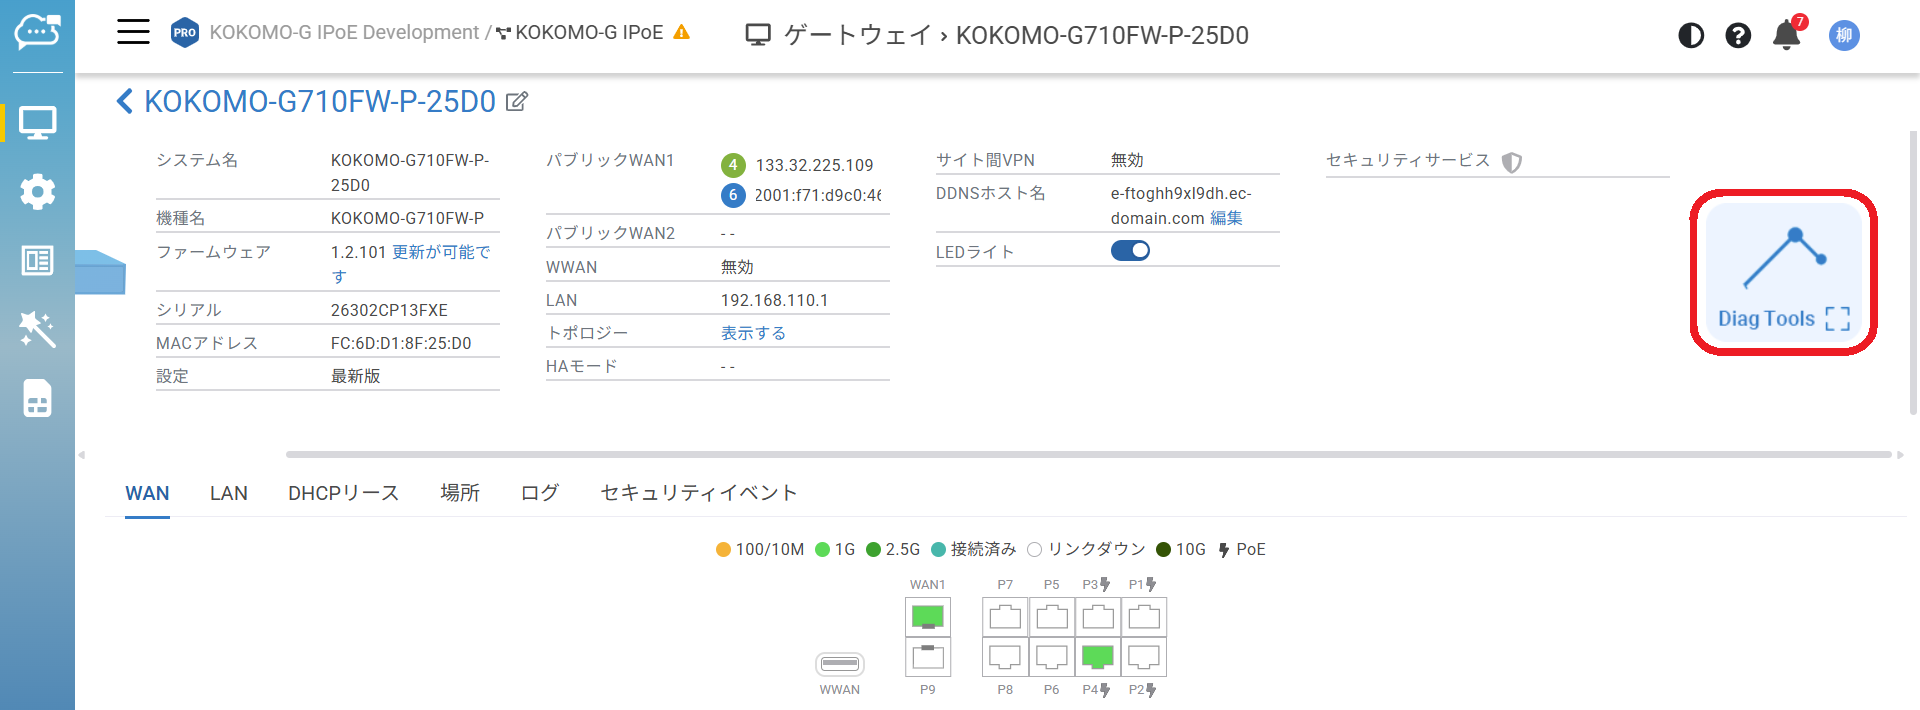
ゲートウェイ詳細ページの「**診断ツール(Diag Tools)**」アイコンをクリックして起動します。
「**管理**」>「**ゲートウェイ**」>「**診断**」からも起動できます。
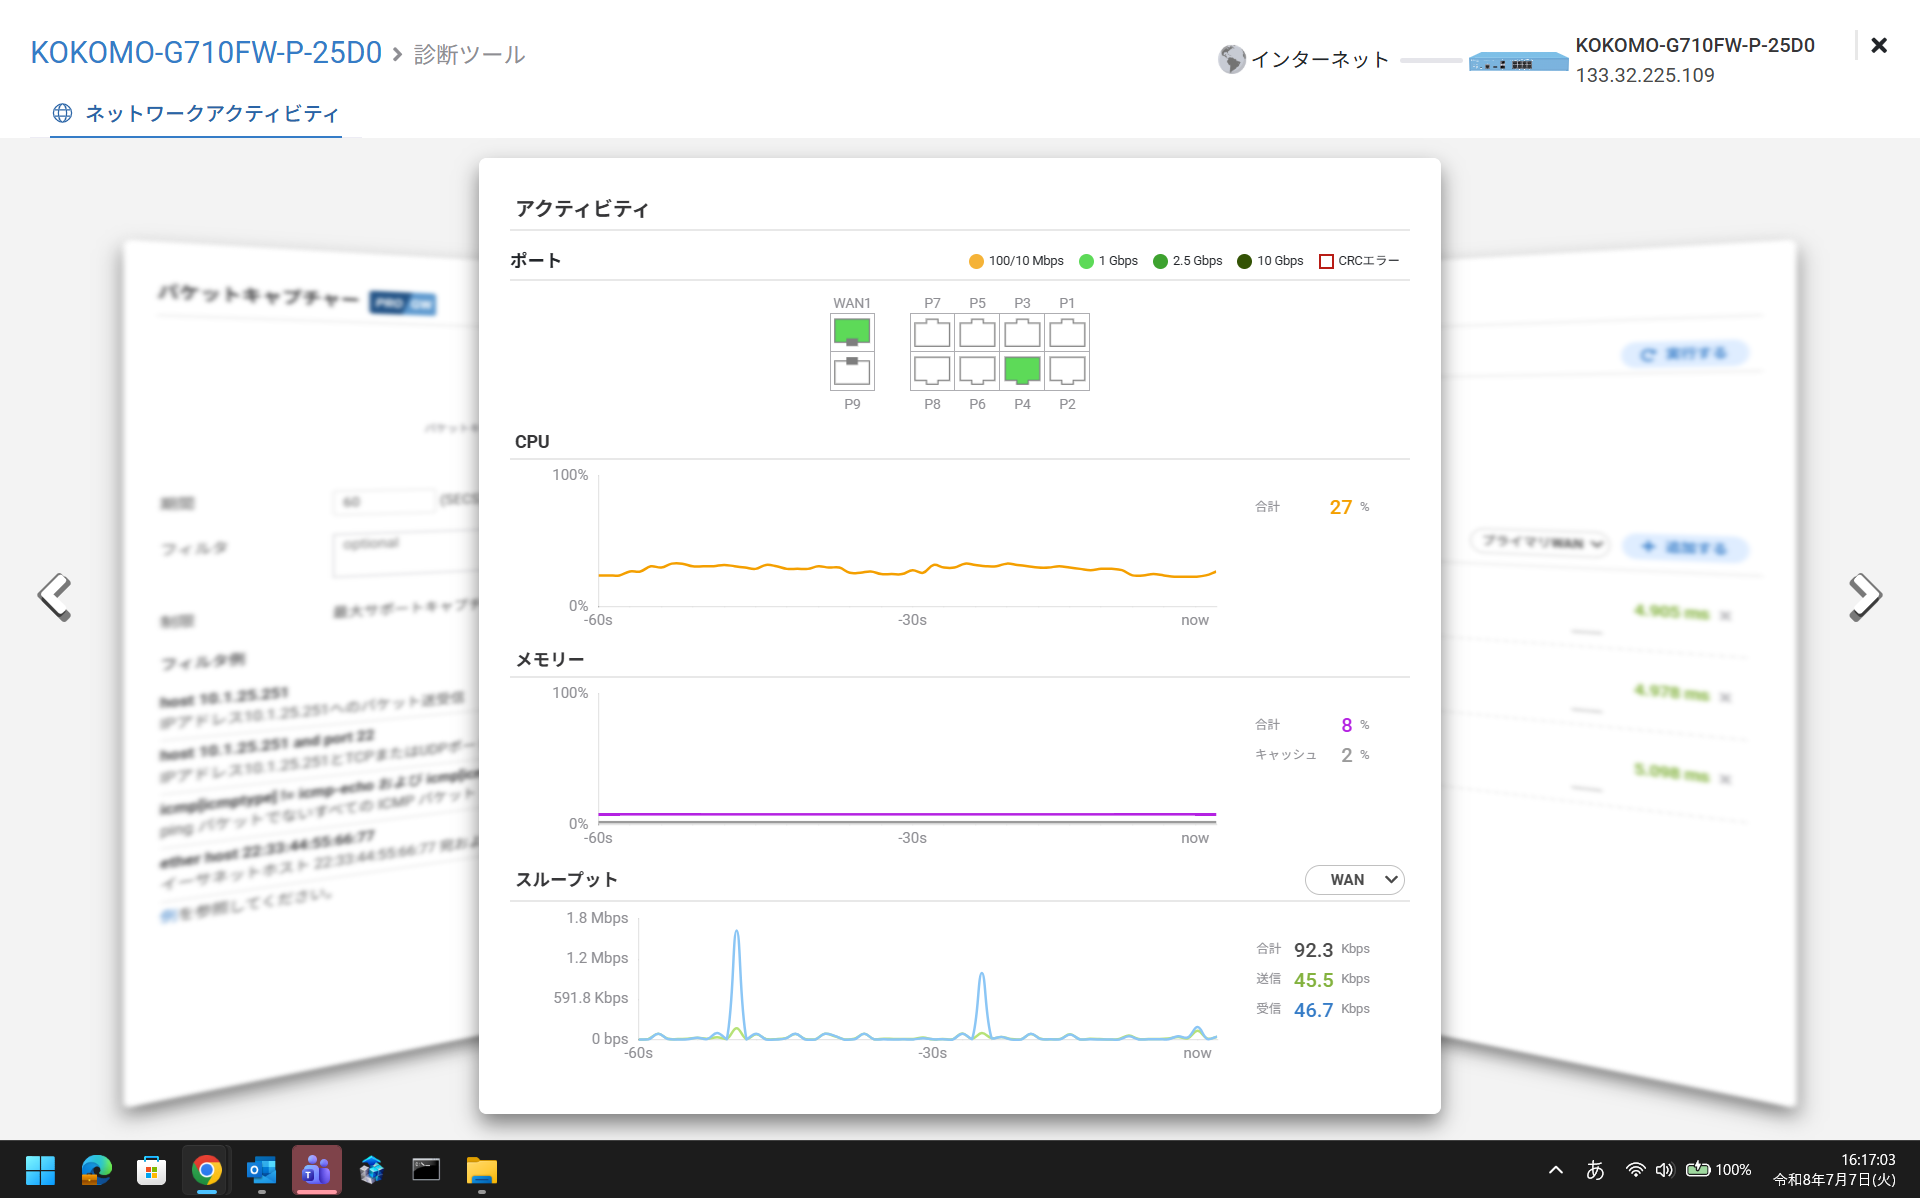
全画面表示でツールを利用できます。
診断ツールはすべてリアルタイムで動作します。
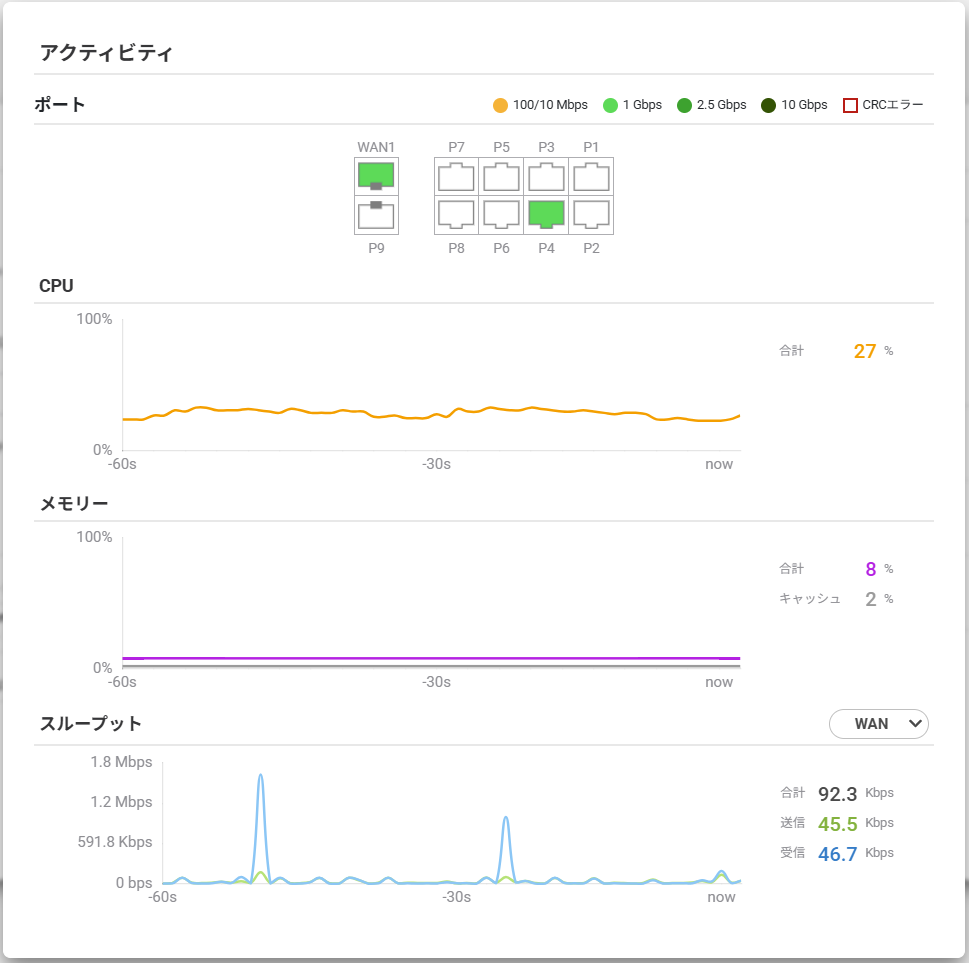
ゲートウェイ診断ツールには、(1)アクティビティ(ポート/CPU/メモリー/スループット)、(2)インターネット接続性、(3)Traceroute、(4)パケットキャプチャーが含まれます。
## アクティビティ
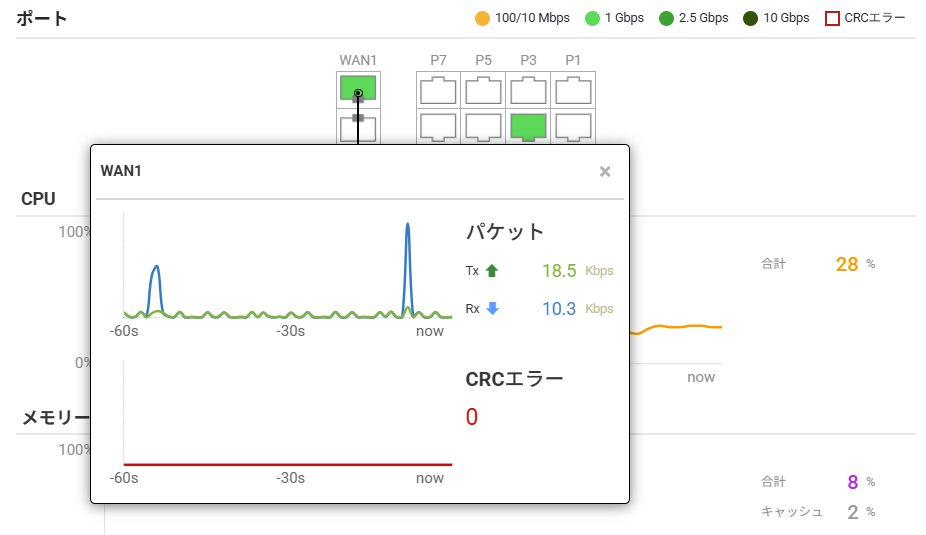
現在の情報を示します。ポートをクリックすることで、当該ポートのパケット送受信、CRCエラーを確認できます。
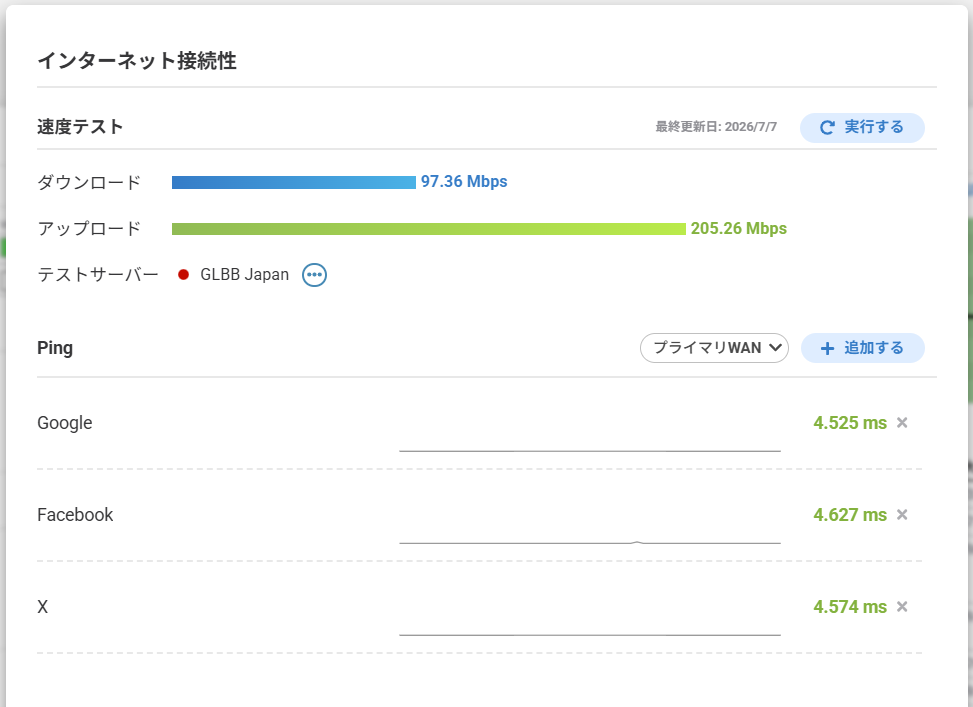
## インターネット接続性
* **速度テスト:**「**テストサーバー**」のリストから選択して実行できます。
* **ping**:デフォルトで3つのサーバーが指定されており、レイテンシの変化を確認できます。ユーザーが独自のサーバーを指定することも可能です。
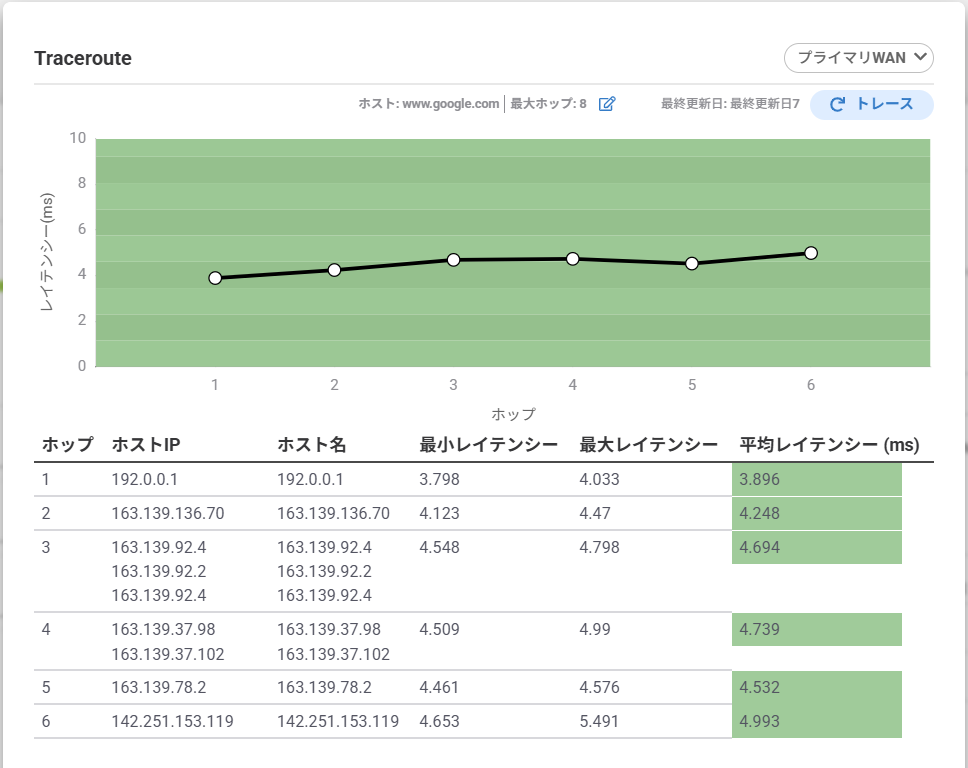
## **Traceroute**
デフォルトで、送信先はGoogle、最大ホップ数は8に設定されていますが、ユーザーによる変更が可能です。tracerouteにより、ゲートウェイから送信先までの経路上の各ルーター/ゲートウェイ(ホップ)とそのレイテンシをリスト表示します。送信先が到達不可能な場合はルーター/ゲートウェイの設定に問題がある可能性があります。また、各ホップのレイテンシから、どのルーター/ゲートウェイがアップリンク速度低下の原因かを特定できます。レイテンシが10ms超で黄色、40ms超で赤色の表示となります。
## パケットキャプチャー
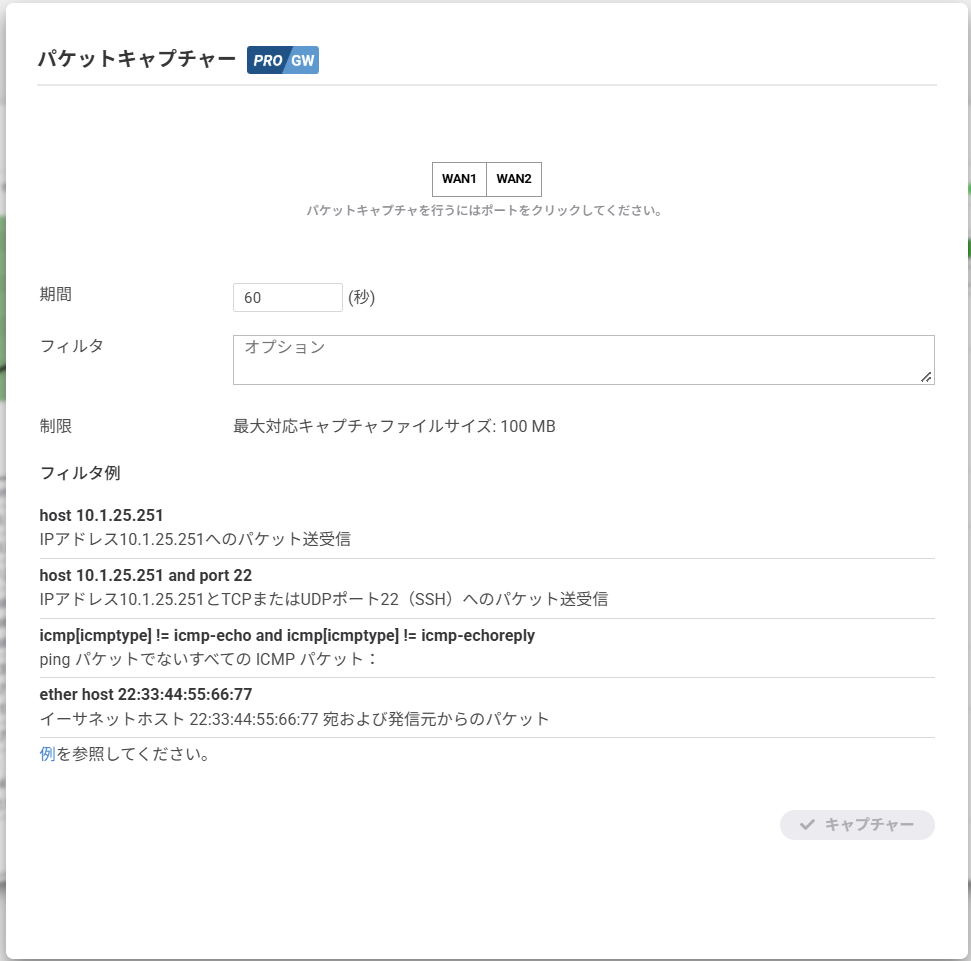
パケットキャプチャー機能は、KOKOMOゲートウェイを通過するライブのネットワークトラフィックを観測するのに使用できます。キャプチャーはネットワーク上のトラフィックのライブスナップショットを取得するため、ネットワークの診断やトラブルシューティングに非常に有用です。本項では診断ツールにおいてパケットキャプチャーをリモートで取得する方法を説明します。
### 使い方
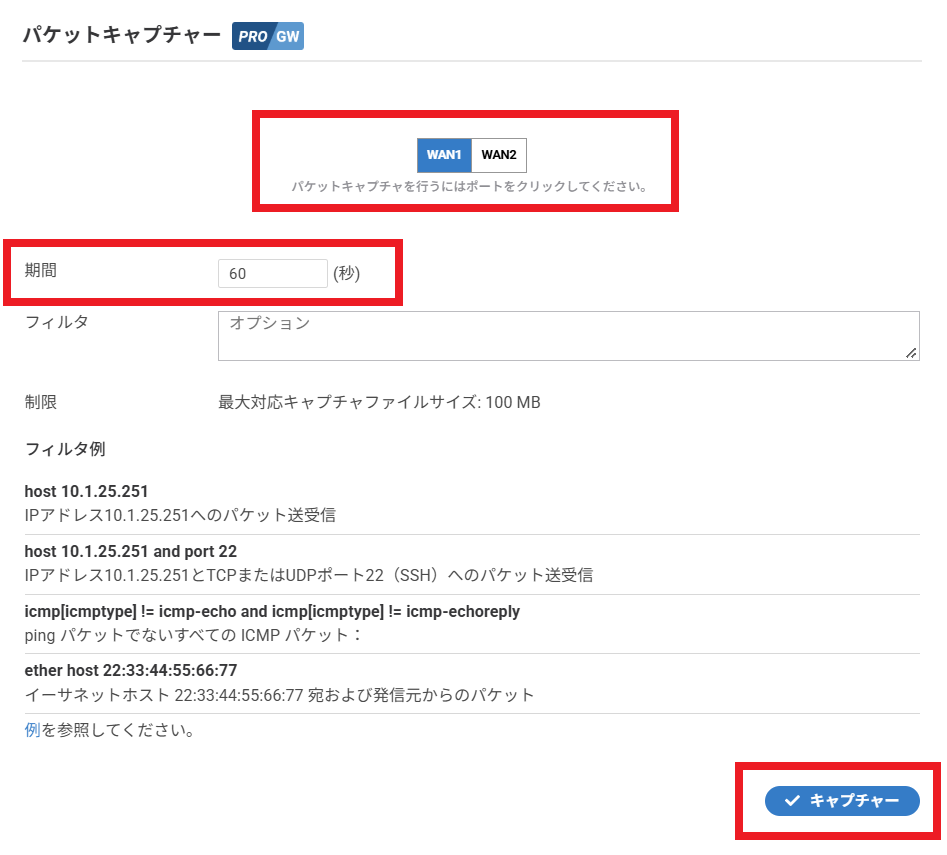
1. キャプチャー対象のポートを選択し、「**期間**」を秒数で入力して、「**キャプチャー**」をクリックします(必要に応じてフィルタを設定してください。フィルタはtcpdumpのフィルタに準じます)。\
すると、ゲートウェイがパケットを収集し、.pcapファイルとしてダウンロードします。
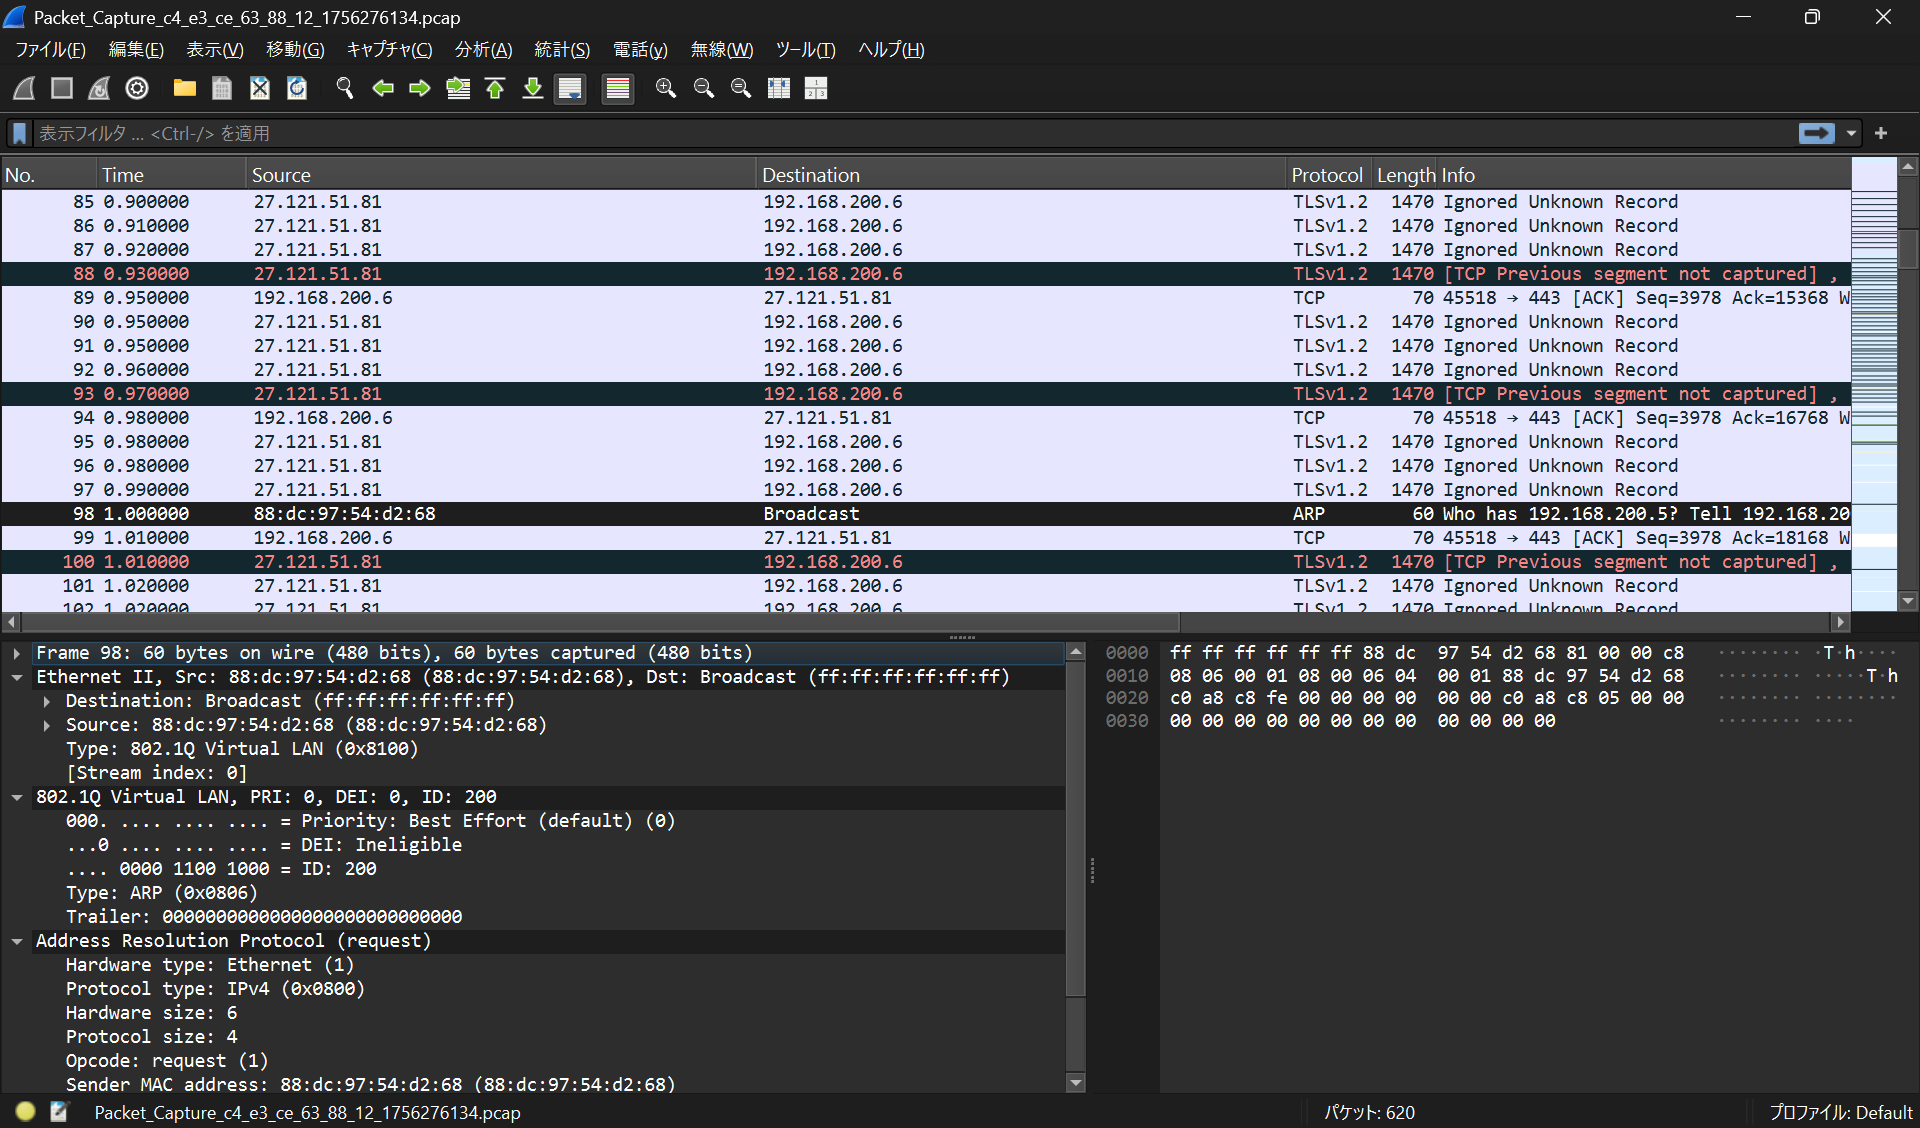
2. Wireshark等のパケット解析ツールをダウンロードして.pcapファイルを開きます。
---
# Agent Instructions
This documentation is published with GitBook. GitBook is the documentation platform designed so that both humans and AI agents can read, navigate, and reason over technical content effectively. Learn more at gitbook.com.
## Querying This Documentation
If you need additional information that is not directly available in this page, you can query the documentation by asking a question.
Perform an HTTP GET request on the following URL with the `ask` and `goal` query parameters:
```
GET https://docs.lan.kokomocloud.com/managing-devices/managing-gateway/diag-tools.md?ask=&goal=
```
`ask` is the immediate question: it should be specific, self-contained, and written in natural language.
`goal` is what the user is ultimately trying to achieve, the reason they need the answer. Sharing it helps GitBook give you a better, more relevant answer. A goal is most helpful when it describes the outcome the user wants rather than restating the question. For example, with `ask=how do I create an API token`, a goal like `automate deployments from our CI pipeline` lets GitBook tailor the answer to that use case.
The response will contain a direct answer to the question and relevant excerpts and sources from the documentation.
Use this mechanism when the answer is not explicitly present in the current page, you need clarification or additional context, or you want to retrieve related documentation sections.